Elaine Garzarelli on Wall $treet Week with Louis Rukeyser
A fun throwback to Elaine on Wall $treet Week with Louis Rukeyser! Laszlo Birinyi,...
Audited from Garzarelli published reports (90.0% Correct Calls)
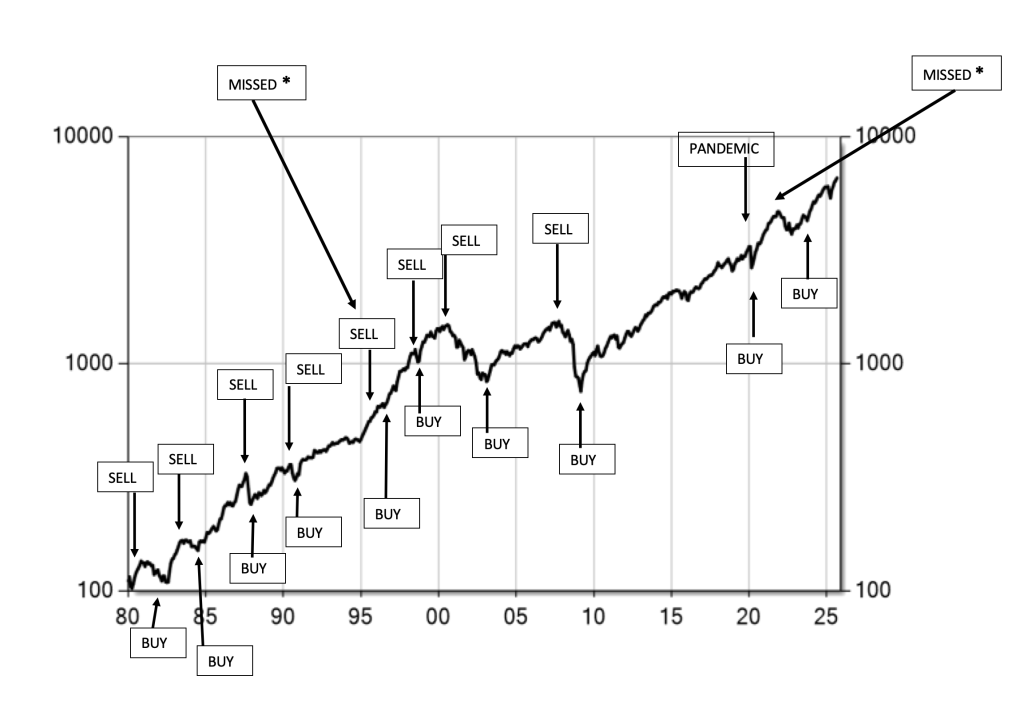
| 1980 | Sell signal in October. |
| 1982 | Indicators called the bear market bottom. |
| 1984 | Indicators called the top and bottom of the bear market within weeks. |
| 1987 | Indicators called the crash; turned bullish in February 1988. |
| 1990 | Sell signal was given in early August 1990, and buy signal given on September 29, 1990. Wall Street strategists were overwhelmingly bearish at the market bottom. The S&P 500 fell over 20.0 percent from the sell signal to the buy signal. |
| 1994 | Remained bullish late in the year when all Wall Street strategists were solidly bearish. |
| 1996* | Indicators bearish using Commerce Dept’s tax-return earnings in our model. This was months before Greenspan made his “irrational exuberance” speech. Such earnings were not distorted with phantom profits such as Enron’s. Commerce tax-return earnings declined from 1997 to 2001, while S&P 500 shareholders earnings advanced and the market incorrectly followed shareholders earnings. Shareholder’s earnings were falsely inflated by including phantom profits and fraudulent practices. This was finally brought to a head with Enron and S&P issuing a “core earnings” measure. The market created a bubble that eventually burst. |
| 1997 | Indicators bullish in early February when we began using shareholder profits instead of income-tax earnings in our models because shareholders profits are what Wall Street followed. |
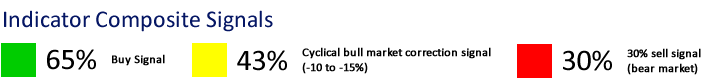
| 1998 | Indicators fell to a 42 percent correction level in May, and to a bullish reading of 75 percent in early October. S&P 500 declined 19 percent from July 17 to October 8. |
| 1999 | Indicators showed the S&P 500 was more than 45 percent overvalued using S&P profit numbers. Indicators dropped to below 40 percent in June, but not yet to a 30 percent sell signal. |
| 2000 | Indicators fell below 30 percent bear market signal in early April. |
| 2001 | Indicators turned bullish when Fed eased in January; April was a successful test and a 20 percent S&P 500 rally followed with stronger rallies for some other indexes. Terrorist attack on the WTC (9/11) caused another drop. Indicators were bullish in late September. Stocks rallied over 20 percent. |
| 2002 | Indicators showed rally was over in March-April. Russell peaked on April 16, for a 40 percent rise, while the Nasdaq rose about 50 percent. Indicators were at 42 percent correction signal by mid-June, before the 20 percent July decline. The indicators rose over 65 percent in late August, before the 2002 bottom on October 9th. To the bull market top (Oct. 9th, 2007), the S&P 500 was up 101.5 percent and the Dow 94.4 percent from their 2002 bear market bottoms. |
| 2003-06 | Indicators bullish. S&P 500 up from 2003 to April 2006. |
| 2006 | Indicators fell in early May to correction level of 41.5 percent. We called for a 5 to 10 percent correction for the S&P 500. The S&P 500 fell by 8.0 percent and the Nasdaq by 15.0 percent. We said correction was over on June 13th. |
| 2007 | Indicators bullish. S&P 500 peaked in October. |
| 2008 | Correction signal given January 4th at 41.0 percent, at S&P 500 1447.0. Bear market sell signal given in March. Short-term buy signal on August 8, but in early September instituted 100.0 percent hedged position through December 31st, and S&P 500 dropped by 42.0 percent from September to December. |
| 2009 | Continue 100.0 percent hedge until March. March 13th unhedged portfolios for 100 percent exposure to equities. April 3, 2009 indicators rose to over 65.0 percent. |
| 2010 | Hedge signal in April and then end of correction signal in July. Continuation of bull market. |
| 2011 | Bullish |
| 2012 | Bullish |
| 2013 | Bullish |
| 2014 | Bullish |
| 2015 | Bullish |
| 2016 | Bullish |
| 2017 | Bullish |
| 2018 | Bullish |
| 2019 | Bullish |
| 2020 | Pandemic stock decline and recession. Called bottom in stocks and predicted V–shaped market rise |
| 2021 | Bullish |
| 2022* | Cycles distorted by pandemic. Did not get a sell signal. |
| 2023 | Bullish |
| 2024 | Bullish |
| 2025 | Bullish |
In 1996, our models issued a cautious signal anticipating a downturn in corporate tax-return profits beginning in 1997. This projection preceded then-Federal Reserve Chair Alan Greenspan’s well-known “irrational exuberance” speech by several months. Our forecast proved correct: tax-return profits declined steadily from 1997 to 2001.
However, reported S&P 500 shareholder earnings diverged from reality, inflated by phantom sales and widespread accounting irregularities—issues that only came to light later through scandals involving companies such as Enron and WorldCom. Under normal circumstances, equity prices should have remained relatively flat from 1996 to 2000. Instead, market participants followed these distorted earnings into a bubble phase. We adapted by incorporating shareholder earnings data into our model in early 1997, allowing us to participate in the subsequent market rally.
In 2022, our composite indicator did not generate a sell signal prior to the market’s downturn. This anomaly was the result of unprecedented pandemic-related disruptions, during which monetary policy, economic cycles, and market cycles became desynchronized due to large-scale government interventions. The economic cycles have since returned to a more normal pattern.
INDICATOR SIGNALS from Sector Analysis reports published by A.G. Becker, Shearson American Express, Lehman Brothers, and Garzarelli Capital. (Audited results by Coopers & Lybrand from published reports). Each year’s explanation is available upon request.

A fun throwback to Elaine on Wall $treet Week with Louis Rukeyser! Laszlo Birinyi,...
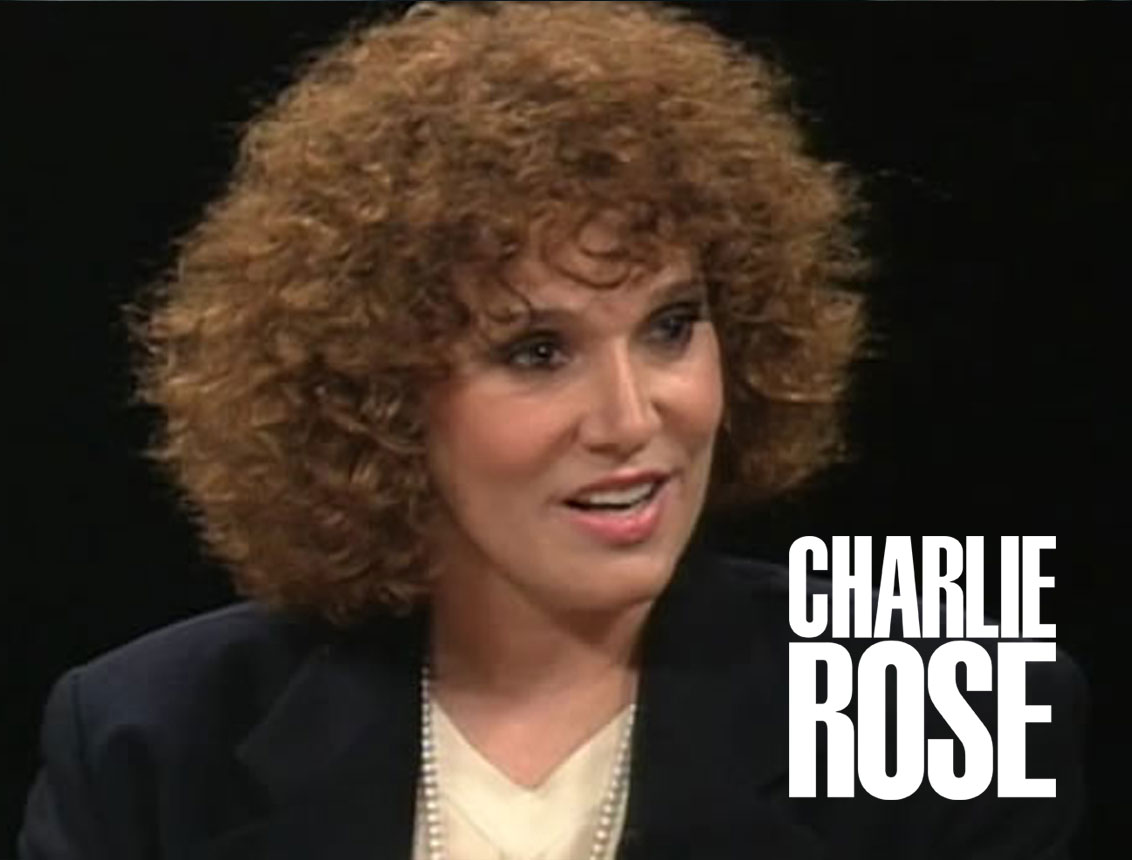
Economist and analyst Elaine Garzarelli explains how she became an analyst and offers her...

By Assif Shameen On Nov 18, key US stock indices, the Standard & Poor’s...
About every week Elaine Garzarelli will report her forecasts in this online publication (along with other updates). She will recommend which sectors and ETFs to invest in, and she will predict the direction of the stock market. In addition, the issues will contain Elaine's analysis of current economic events.